
Leveraging fundus images for on device eye disease diagnosis with AI powered lightweight software hardware framework

The different stages involved in the design of the integrated portable fundus image diagnostics device is as given in Fig. 1. The image capture module is an essential component responsible for capturing high-resolution fundus images consisting of sensor, lens, and image processing circuitry. The multiple images at different eye rotations are taken and stitched to generate a wide field of view using a feature-based method. Keypoints are detected using the SIFT algorithm and matched across images. The average stitching time per image set was 1.5 s on Arm cortex A76 processor. AI processing unit is responsible for the deep learning-based analysis of fundus images. It comprises a powerful processor capable of running complex deep-learning algorithm which recognizes various fundus-related diseases by analyzing image features. A pre-trained model is embedded in the processor. The display interface provides a user-friendly means of visualizing diagnostic results and interacting with the device. It typically includes a touch screen to display fundus images, disease diagnoses, and other relevant information. The connectivity options include Wi-Fi for remote data transfer and USB for local data exchange, facilitating professional remote diagnostics and off-site cloud image storage and processing.

Different stages involved the design of the integrated portable fundus image diagnostics device.
System design: hardware imaging unit
The Retinal fundus images are acquired using the Raspberry Pi (RPi-5) compute module, a five-megapixel camera module with the field of view equal to 56 degrees, and an adjustable 20D aspheric lens used for necessary magnification and minimizing optical distortions. The RPi camera module is assembled in a 3D-printed custom adapter, and aligned to a binocular indirect ophthalmoscope case housed inside a 3D-printed enclosure. The light from the LED ring is used for transpupillary illumination of the fundus for image acquisition. The illumination can be controlled according to the surroundings and can be adjusted as per the patient’s requirement and size of the eyeball. The use of diffusion paper softens the light and distributes it evenly throughout the field, preventing harsh shadows and achieving uniform light distribution. The retina is consistently lit when the eye is positioned appropriately as it is carefully aligned with the focal point. By increasing clarity and decreasing artifacts brought on by uneven lighting, this exact alignment raises the quality of the image. An adjustable lens system is used which is intended to improve the clarity and focus of the fundus photos. By adjusting the lens location, this technique makes it possible to fine-tune the focal point, accommodates differences in eye placement, and guarantees that the target region is sharply focused. Because of this flexibility, even minor eye positional misalignments can be fixed, enhancing the image quality without forcing the patient to move.
The ability to modify shutter speed and ISO values to improve auto-exposure is also incorporated. The system’s shutter speed is crucial for high-quality fundus images, preventing overexposure and underexposure. It reduces motion blur and improves image brightness and contrast. Adjusting the speed adapts to lighting conditions, ensuring accurate feature detection and disease analysis for conditions like DR, glaucoma, and AMD. The design of the portable structure for holding the camera and lens with the provision for the patient’s chin to rest is shown in Fig. 2a, b and c.

(a, b, c) Structural overview of the imaging device.
Preprocessing
Retinal fundus imaging is crucial for ophthalmologists to diagnose retinal diseases early, enhancing cure chances and preventing blindness. Figure 3 shows the process adopted in the presented work for pre-processing and training of retinal fundus images. The acquired retinal images are transformed into separate channels for comprehensive eye anatomy analysis, isolated essential regions, and standardized dimensions (256 × 256) for efficient analysis22, enhancing the accuracy and robustness of the developed device.
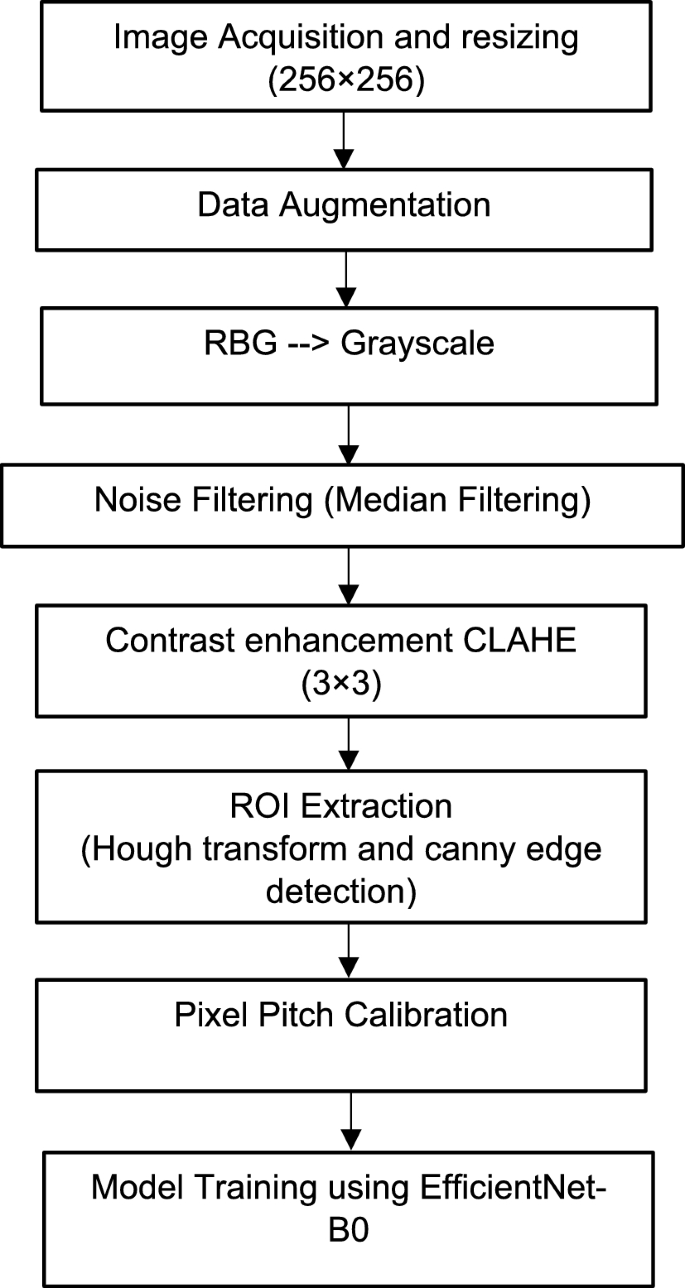
Pre-processing and training of the acquired retinal fundus images.
To preserve useful information, a median filter is used to reduce noise in an image followed by contrast enhancement. Contrast Limited Adaptive Histogram Equalisation (CLAHE) for improved neighbourhood pixels is used to improve the appearance and information value of original image. Specifically applied to greyscale retinal images, CLAHE enhances visual contrast by applying contrast-limited histogram equalization (CLHE) to pixels and then uses bilinear interpolation to patch the neighbouring pixels back together. Accurately measuring fundus structure is also crucial, as is obtaining the morphological features of retinal structure for the diagnosis of different illnesses.
Geometric calibration of the image is necessary to guarantee the uniformity of the retinal image captured by various cameras. Here, pixel pitch calibration technique29 is used to accurately depict the features in their actual locations. The average pixel pitch (PP) is calculated as given in Eq. (1)
$${\text{PP}} = {\text{ Optic disc Diameter}}/{\text{ Optic disc pixel count}}$$
(1)
By calibrating the pixel pitch, it is ensured that the features such as lesion size and blood vessel width are measured in consistent physical dimensions, leading to reliable detection and analysis.
Dataset
For this work, a diverse and publicly available dataset of fundus images are sourced from the EyePACS dataset on Kaggle and hospitals around the globe. This dataset includes mydriatic images representing various eye diseases, such as diabetic retinopathy, glaucoma, age-related macular degeneration, and healthy (normal) cases, curated to ensure sufficient representation across different disease classes (Table 1). The dataset was divided into three parts to facilitate effective training and evaluation of the model ensuring robust model performance evaluation.
The demographic features such as age, region, and race/ethnicity are also utilized to train the model for disease classification, specifically for detecting conditions like diabetic retinopathy, glaucoma, and Age-Related Macular Degeneration (AMD). The total breakdown (for approx. 7000 images) is given in Table 2.
Deep learning model architecture
Using convolutional layers for feature extraction and classification, pooling layers for feature reduction, and a fully connected layer for classification, CNN is an essential technique in image analysis21. EfficientNet-B0, a variant of the EfficientNet family is built using several key components that work together to efficiently process images and extract meaningful features. The stem, a series of convolutional layers in EfficientNet-B0, processes the input image to extract basic features like edges, textures, and simple shapes, ensuring a good representation of low-level features. The model uses Mobile Inverted Bottleneck Convolutions (MBConv) to efficiently process images. These blocks consist of depth-wise convolution, pointwise (1 × 1) convolution which mixes features from different channels, expansion, squeeze-and-excitation (SE) block, and residual connections. The depth-wise convolution reduces computational cost and parameters while capturing spatial information. The expansion layer increases the number of channels in the feature map, while the SE block recalibrates feature map channels dynamically. The use of compound scaling, aids to maintain efficiency and balance in computational cost and model accuracy. The Spatial Attention Block module improves CNN performance by assigning weights to significant features within the image’s spatial dimensions. Without altering the channel information, the lightweight Spatial Attention Block module assists a CNN locating the position of significant features situated within the 32 × 32 spatial dimensions of a feature map. By assigning weights to various spatial parts of the image according to their significance, it improves the feature representation and is included after a convolutional block. This enhances feature representation and allows for prioritization of lesion-rich areas without additional computation, enhancing overall classification performance with minimal computation increase. The network’s final output is processed through a global average pooling layer, which reduces feature map dimensions. The output is then passed through a fully connected layer with a SoftMax activation function to generate classification probabilities for disease detection in fundus images. Swish activation function improves training convergence. Dropout layers are used in the final fully connected layers to prevent overfitting by randomly deactivating some neurons during training. Table 3 details the deployed network architecture.
EfficientNet-B0 is a powerful yet resource-constrained architecture that achieves high accuracy with fewer parameters and computations (Table 4). Its lightweight design scales network depth and width, minimizing parameters, and enables real-time operation on edge devices that rely on battery power or need to operate in environments with power constraints.
Post training heatmap generation for classification
Once the model is trained, Grad-CAM technique is applied to the trained model to extract the heatmap so as to highlight areas of the input images that the model considers important for its predictions. These extracted features form input to a pre-trained image net model for the downstream task of classification of various stages of the disease. Heatmaps were generated from the last convolutional layer of the EfficientNet-B0 model as this layer retains spatial information crucial for understanding the disease-related features. This is done to ensure that the relevant features are highlighted for different diseases as indicated below in Table 5. The visualization technique Grad-CAM indicates which regions of a fundus image the deep learning algorithm concentrates on in order to identify diseases. For Diabetic retinopathy (DR) as an example, it detects areas called hemorrhages (blood spots), hard exudates (yellow-white patches), and microaneurysms (little red dots). These areas are shown as bright or warm-coloured regions (like red/yellow) in the Grad-CAM heatmap in Table 6. Grad-CAM is a helpful explainability tool that supports medical reasoning because ophthalmologists also employ these clinically relevant indicators. The EfficientNet-B0 model predicts a class by analyzing a fundus picture. Grad-CAM then tracks the gradients of the predicted class with respect to feature maps using the last convolutional layer, which preserves spatial information, to determine which regions had the most influence on the prediction. Table 6 presents the processed images at different stages along with the extracted heatmap.
Indicators of evaluation
Each category’s confusion matrix is found by comparing the expected and actual labels. Precision, sensitivity (recall), specificity, F1, and accuracy are the performance metrics used to evaluate the model performance28. In addition, Area Under the Curve (AUC) is also used as a measurement index.
$$\text{Precision}= \frac{\text{TP}}{\text{TP}+\text{FP}}$$
(2)
$$\text{Sensitivity }\left(\text{Recall}\right)= \frac{\text{TP}}{\text{TP}+\text{FN}}$$
(3)
$$\text{Specificity}= \frac{\text{TN}}{\text{TN}+\text{FP}}$$
(4)
$$\text{F}1 -\text{score }=2 \times \frac{\text{Precision }\times \text{Recall}}{\text{Precision}+\text{Recall}}$$
(5)
$$\text{Accuracy}= \frac{\text{TP}+\text{TN}}{\text{TP}+\text{FN}+\text{TN}+\text{FP}}$$
(6)
where TP, True Positive; TN, True negative; FP, False Positive; FN, False Negative are components of the confusion matrix indicating presence and absence of the disease.
Results
The F1 score, Sensitivity, Specificity, and AUC values of the proposed model are recorded on the test set of the distinct dataset in order to confirm its superiority. These values are derived by averaging the outcomes of fivefold cross-validation and are shown in Table 7. The confusion matrix for the multi-label task completed using the suggested architecture is displayed in Table 8. The test images also include the images captured through the developed prototype.
On investigation of false positive cases, the model concentrated on non-pathological peripheral aberrations misidentifying clinically important regions like the optic disc or macula. In several false negatives, the model’s scope was too wide, preventing it from detecting tiny lesions like microaneurysms or early exudates that are crucial for an accurate diagnosis. Table 9 compares the suggested EfficientNet-B0 architecture’s performance against reported deep learning frameworks.
The model pretrained solely on ImageNet achieved a lower accuracy of 85%, highlighting its limitations in generalizing to the specific task. In contrast, Efficient Net, pretrained on ImageNet, achieved an accuracy of 96.2%. The architecture of Efficient Net, which properly balances network depth, width, and resolution resulting in powerful feature extraction and better generalisation, is responsible for this considerable increase. The performance of the suggested model for the multi-label task is contrasted with published work by various researchers in Table 10. While deep learning and software-based models have shown strong performance in detecting single eye diseases using fundus images (Table 10), no reported work has fully integrated low cost imaging hardware with diagnostic software into a unified system. Current research primarily focuses on software models using pre-acquired images, with limited attention to end-to-end systems that combine image capture and automated multi-disease detection in real time for raw low resolution fundus images. This highlights a critical gap in existing solutions: while diagnostic accuracy for individual conditions is improving, there is a lack of end-to-end, multi-disease, hardware-integrated systems that can support screening at the point of care.
The decision to use EfficientNet-B0 over other architectures is driven by its superior trade-off between accuracy and computational efficiency, which is critical for edge computing and its deployment on resource-constrained device Raspberry Pi 5 used for the development of an integrated device for eye disease diagnostics. The TensorFlow Lite model is used for optimized inference on the Raspberry Pi 5 which uses Arm cortex A76 processor. In batch processing mode (10 images per batch), the system processed images in approximately 8 s, facilitating efficient analysis during medical examinations (Table 11).
The developed AI-enabled decision support system prototype (Fig. 4) not only demonstrated high accuracy in detecting eye diseases but also showed notable computational efficiency.

Prototype of the developed model and GUI for fundus imaging and analysis.
Timing analysis was conducted to evaluate the model’s suitability for real-time applications, and the model achieved an average inference time of 5 s per image on the Raspberry Pi, allowing for quick diagnosis. The inference time is negligible compared to the overall clinical workflow, which is dominated by patient handling and image capturing. Patient eye dilation time is a significant part of the clinical workflow for fundus imaging as the waiting time for pupil dilation may vary from 15 to 30 min. The inference time remains < 0.5% of this total duration.
Thus, the proposed fundus image collection device allows for precise image acquisition, thorough analysis, and integrates the developed deep learning framework to enhance healthcare decisionmaking. The graphical user interface for enhanced user experience is also developed.
link


