


Data collection
To proactively tackle mental health issues and needs among the elderly, an elderly psychological care campaign was initiated by Jinshan Mental Health Center. The project was integrated with health examinations for the elderly. We deployed fundus photography machines and multimodal machines collecting eye information while gathering psychological data. This study received approval from the National Clinical Research Center for Ophthalmic Diseases and the Ethics Committee of Shanghai Jinshan Mental Health Center. Communities called on participants aged over 55 to attend community hospitals for physical examinations and simultaneous mental health screenings. The participants consented to the open publication of the data. The demographics of the participants were shown in the uploaded Excel file. Sex, age, height, weight, body mass index, and hypertension status were provided.
Fundus photography, psychological assessment, retina characteristics, and multimodal Imaging (FPRM) dataset encompassed multimodal imaging data and quantitative measurement, fundus photography, psychological assessments, and retina characteristics. Fundus photography of both eyes was collected from 1683 participants in three hospitals, with a comprehensive assessment of retina characteristics. Besides, 1683 participants completed psychological questionnaires, yielding psychological-related data, and 384 participants underwent multimodal examinations, resulting in multimodal imaging data (Fig. 1).

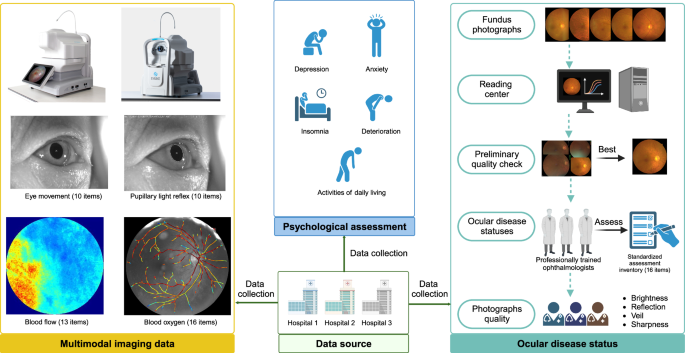
Flow chart of FPRM dataset.
Acquisition of fundus photographs
Photographers were unaware of participant information and received training on adhering to standardized operating procedures. During the capturing process, patients were in a seated position, with the lower jaw placed on the lower jaw support. Fundus photographs were collected (Smartscope PRO, Optomed Oy, Oulu, Finland16,17). All images were collected by experienced ophthalmologists (Fig. 1).
Image processing procedure
For the same participant’s one eye, we captured multiple fundus photographs. After capturing, the fundus photographs were uploaded to a dedicated reading center for information exchange. Initially, a preliminary quality check was performed on the raw image data at the reading center. To enhance dataset usability, only the best photo for the same participant’s one eye was retained. Subsequently, three professionally trained ophthalmologists assessed the retina characteristics based on the retained photo. To ensure dataset quality, we evaluated image quality in terms of brightness, reflection, veil, and sharpness. The quality assessment task was carried out by three retinal specialists, each with more than 5 years of experience (Fig. 1). Detailed descriptions were provided below.
Assessment of fundus photographs quality
To ensure the suitability of dataset for various research applications, we assessed image quality based on four aspects (brightness, reflection, veil, and sharpness). The quality assessment task involved 3 ophthalmic experts (each with > 5 years of experience) evaluating 3361 fundus photographs using a monitor positioned at approximately 30 cm viewing distance. Any disagreements were adjudicated by an ophthalmic expert with over 10 years of experience. Prior to the task, we developed a universal quality grading scale (Table 1). The scale comprised four parts, collectively forming a four-digit binary number, such as 0011, 0101, 1001, and 1100. Each set of four digits represented the quality of one image, with a value of 1 indicating alignment with the quality assessment scale, and 0 indicating misalignment.
High quality images are utilized for analyzing the relationship between fundus photographs and deterioration, activities of daily living, insomnia, generalized anxiety disorder, and geriatric depression, or for co-training machine learning for the assessment of 20,118 retina characteristics, or for exploring the association between fundus photographs and multimodal imaging. Poor quality images are frequently encountered in clinical practice, so including these images provides a systematic approach to simulate the real world and examine the efficacy of machine learning under different image qualities.
Assessment of retina characteristics
The assessment of retina characteristics was independently conducted by three professionally trained ophthalmologists. Any disputes were resolved through consensus. We developed a standardized assessment inventory, and each professionally trained ophthalmologist assessed all participants based on the standardized assessment inventory (Supplement Table 1). The final results consisted of 6 items, with each result of items represented by 0 or 1. For ease of analysis, they collectively formed a 6-bit binary number. Each set of 6 bits represented a feature of a photo, where the 1 indicated an event occurrence, and 0 indicated non-occurrence. The current diagnostic process was quite rigorous, with almost all retina characteristics being determined. This dataset provided fundus photos of both healthy individuals and those with various abnormal retina characteristics, serving as material for machine learning.
The assessment of retina characteristics included microaneurysm, intraretinal hemorrhage, hard seepage, drusen, cotton wool spot, and macular edema.
Acquisition of multimodal data
Description of multimodal machine
Multimodal imaging data was performed by the Multimodal Eye Functional Imaging and Analysis System (Discovery Model E, SysEye Technology LTD., Chongqing, China), a novel integration of retinal multispectral imaging (MSI), retinal oximetry, and laser speckle contrast imaging (LSCI), employed for functional imaging of retinal vessels, enabling early detection or monitoring of functional changes13. This method has been utilized in published studies7,12,18. We integrated structural and functional retinal imaging techniques, conducting fundus color imaging under illumination from light-emitting diodes (LEDs) at wavelengths of 470 nm, 550 nm, and 600 nm. Retinal oxygen saturation measurements were performed under 550 nm and 600 nm LED illumination. Employing 850 nm laser diode illumination at 82 frames per second, blood flow was evaluated using LSCI. LSCI enables visualization of retinal vessels without the requirement for exogenous contrast agents and provides time-resolved blood flow information. The retinal oxygen saturation is calculated based on differences in tissue absorption spectral characteristics and spectrophotometric measurement techniques, which are directly correlated with optical density values. Analysis of dual-wavelength images, including registration, vessel segmentation, and optical density ratio calculation, provides information on the oxygen saturation distribution of retinal arterioles, venules, and capillaries. We created an oxygen concentration map of retinal vessels and quantitatively analyzed the oxygen saturation of 4 arteries and 4 veins adjacent to the optic disc (Fig. 1). All information was collected from right eye.
Data collection of multimodal imaging data
We collected information from multiple modalities (61 items), including blood oxygen levels in the eye, eye movement, pupillary light reflex, and blood flow. Additionally, to facilitate public analysis of this data, we also provide information generated during the calculation process (Supplement Table 2).
Blood oxygen levels in the eye
Retinal images were taken of participants at wavelengths of 548 and 605 nm, and optical density (OD) values were computed from the grayscale values within and surrounding the blood vessels. The SO2 concentration was then calculated from the OD values. Finally, the oxygen saturation was calculated based on the SO2 concentration.
Average blood oxygen saturation of vessel 1–8 in the right eye and average blood oxygen saturation of vessel 1–8 in the left eye.
Eye movement
First, we captured video of the eyes of participants. A threshold-based segmentation approach was used to detect the centers of the pupils and corneal reflection points in each video frame. Variations in the distance between the pupil center and corneal reflection point indicate changes in the gaze of the participants. Utilizing the curve of distance changes between the pupil center and corneal reflection point, we computed data related to eye movements.
Ratio of right eye movement speed to task target speed, eye motion latency binocularly, average velocity of the 1–3 eye movement binocularly, ratio of left eye movement speed to task target speed.
Pupillary light reflex
Initially, we recorded videos of the eyes of participants. A threshold-based pupil segmentation algorithm was employed to segment the pupils in each video frame. Elliptical fitting of the segmented pupil boundaries yielded the major axis lengths and central coordinates of the pupils at various times. Subsequently, the data on the major axis lengths of the pupil at various times provided the baseline pupil size, the initiation point of constriction, and the minimum diameter of the pupil, thus yielding the data of pupillary light reflex.
Pupil diameter at rest, minimum pupil diameter after light stimulation, pupillary constriction amplitude, ratio of pupillary constriction amplitude to baseline pupil diameter, time from onset of light stimulation to initiation of pupil constriction, duration of pupillary constriction, pupil recovery time from maximum constriction to reach 75% of baseline diameter, average speed of pupillary constriction, maximum rate of pupillary constriction, and average speed of pupillary dilation.
Blood flow
We used Laser Speckle Contrast Imaging (LSCI) to assess retinal blood flow, and LSCI is a well-established technique for analyzing blood flow dynamics19,20,21. LSCI offers the benefits of rapid execution and a broad field of view. When a laser illuminates a rough surface, the resulting high interference leads to a speckle phenomenon. As the scatterers, such as red blood cells, move, the speckle pattern appears blurred. This blurred speckle, or speckle pattern image (SPI), captures information from the moving red blood cells and can be recorded by a camera within a given exposure time. Goodman quantified the degree of blur as the laser speckle contrast, thus computing the data of blood flow.
Then, resistivity index, skew, falling rate, raising rate, blow out score, blow out time, acceleration time index, flow acceleration index, blood flow volume/minutes, systole ratio, diastole time, systole time, and heart rate were performed.
The technology simplifies clinical workflows, enabling the swift acquisition of structural MSI images, retinal oxygen measurements, and LSCI blood flow information without the need for patients to move between instruments. All captures were conducted by experienced physicians. This dataset expedited research on diagnosing, monitoring, and elucidating disease mechanisms in the eyes using MSI, retinal oximetry, and LSCI, offering a novel perspective for machine learning.
Acquisition of psychological assessment
Participants filled out the questionnaire in a bright room, and they were seated in a comfortable chair, which contributed to a comfortable environment. All questionnaires were collected by experienced doctors to ensure the accuracy and reliability of the responses, encouraging to obtain genuine answers from participants, providing credible data for the study (Fig. 1). Psychological assessment included geriatric depression evaluated by Geriatric Depression Scales (GDS)22, generalized anxiety disorder evaluated by generalized anxiety disorder (GAD) scales23, insomnia evaluated by Athens Insomnia Scale (AIS)24, activities of daily living evaluated by activities of daily living (ADL) scales25, and deterioration evaluated by Global Deterioration Scale26. The detailed description of the questionnaires is as follows.
Geriatric depression
GDS-15 is a depression scale for the elderly, consisting of only 15 items. It primarily assesses the respondent’s depressive state in the past week, including 15 questions related to mood, reduced activity, withdrawal, negative evaluation, and more. GDS-5 is a brief version of GDS-15, suitable for a quick screening of depressive states. The specific contents of the scale are detailed in the Supplement tables 3, 4. We employed GDS-5 for initial screening, and those with abnormal results proceed to evaluate with GDS-15. The initial screening consisted of 5 questions. A score of 0 indicated no significant depression risk, while a score between 1–5 continued the evaluation with GDS-15. The depression status was determined based on the GDS-15 score, where 0–4 score indicated no depressive symptoms, 5–9 score indicated mild depression, and 10–15 score indicated depression.
Generalized anxiety disorder
GAD-7 is a screening tool developed for generalized anxiety disorder, consisting of 7 items related to anxiety disorders. It assesses the frequency of symptoms related to the past two weeks. Each item uses a 0–3 score and four-level scoring method, with higher total scores indicating greater severity. GAD-2 is a preliminary screening tool based on the GAD-7 scale, containing only the first two items of the GAD-7 scale. We performed GAD-2 for initial screening, and those with abnormal results proceed to evaluate with GAD-7. For GAD-2, a score of 0–2 represented a normal state, and further evaluation with GAD-7 was not needed. The score of 3–6 required continued assessment with GAD-7, and anxiety status was determined based on the GAD-7 score, where 0–4 indicated no anxiety symptoms, 5–9 indicated mild anxiety, and 10-21 indicated anxiety. The specific contents of the scale were detailed in the Supplement tables 5, 6.
Insomnia
The AIS-8 scale is primarily employed to aid in assessing insomnia, comprising 8 items, with each item graded from 0 to 3 for severity. In this survey, AIS-3 was utilized for the initial screening of insomnia, and for those with abnormal initial screening, the complete AIS scale was administered. The classification criterion for our survey was 0 score, signifying no sleep problems. If this criterion was met, the complete AIS scale evaluation was not pursued; otherwise, there may be sleep issues, and the complete AIS evaluation was continued. The complete AIS has a total score range of 0–24, categorized as 0–3 score for no sleep problems, 4–6 score for suspicious sleep problems, and 7–21 score for the presence of sleep problems. The specific contents of the scale were detailed in the Supplement tables 7, 8.
Activities of daily living
The ADL scale was developed in 1969 by Lawton and Brody in the United States, aimed at assessing the daily living abilities of the elderly. This scale is typically administered through interviews with knowledgeable individuals. ADL comprises 14 items, including two parts: 6 items for physical self-maintenance scale (toilet, feeding, dressing, grooming, physical ambulation, and bathing) and 8 items for instrumental activities of daily living scale (ability to use telephone, shopping, food preparation, housekeeping, laundry, mode of transportation, responsibility for own medications, and ability to handle finances). The ADL scale was to be administered by interviewing knowledgeable individuals. Based on the information provided by informants about the elderly individual, an appropriate score was selected. A score of 1 indicated complete independence, 2 implied some difficulty but still manageable, 3 signified being inability to independently complete the task, requiring assistance, and 4 denoted the impossibility of performing the task. A score of 1 on a specific item was deemed normal, while scores from 2 to 4 indicated a decline in function. The minimum total score was 14, and the maximum was 56. A total score less than 16 indicated complete normalcy. If there were 2 or more items with a score of ≥ 3, or the total score was ≥ 22, it suggested functional impairment. The specific contents of the scale were detailed in the Supplement table 9.
Deterioration
For individuals at risk of cognitive impairment, physicians should further assess the Global Deterioration Scale to evaluate the severity of cognitive decline. The scale is divided into seven levels, each with detailed descriptive definitions (Supplement table 10).
link